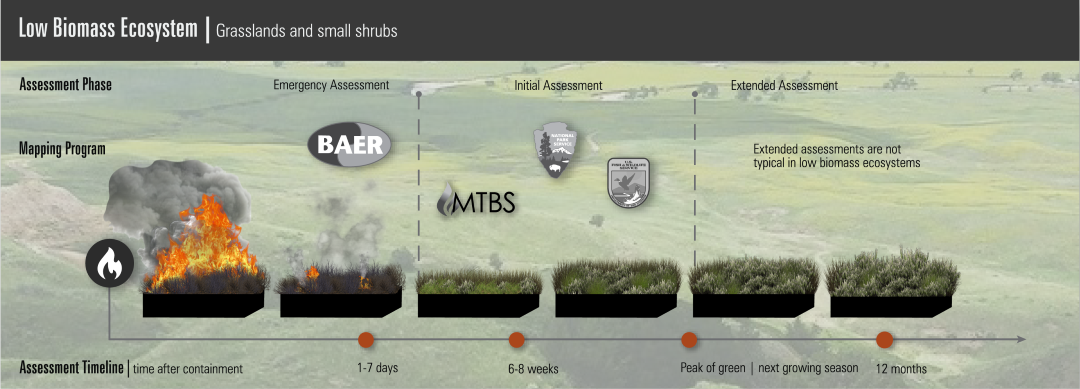
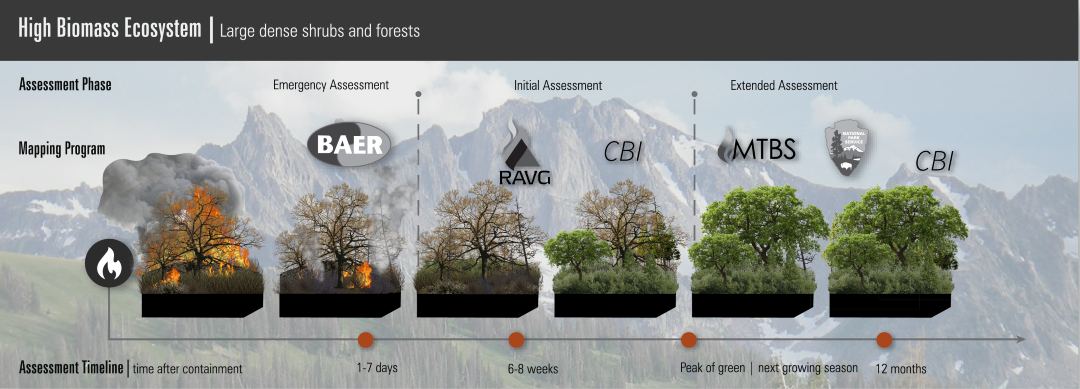
The MTBS program was established to provide a consistent methodology to assess and document the effects of fire at a national scale. Since the program’s inception in 2005, MTBS mapping methods have evolved to accommodate changes and advancements in technology, software, satellite data and the availability of reliable fire occurrence data. It is anticipated these methods will continue to evolve into the future, however, the MTBS mapping approach has consistently occurred in five primary steps:
- Fire Occurrence Data Compilation
- Satellite Image Selection and Pre-processing
- Burned Area Boundary Delineation
- Burn Severity Interpretation
- Data Distribution
Fire Occurrence Data Compilation
Historically, MTBS compiled fire occurrence data from a number of federal and state databases that maintained little consistency in standards for content, geospatial accuracy, and nomenclature. These datasets were then filtered and standardized internally by MTBS staff in an effort to reduce duplication of incident records reported by multiple agencies, and to resolve gross geospatial inaccuracies that were commonly found in the source data.
In recent years, significant improvements have been made to streamline the reporting procedures and data exchange for land management agencies in their creation and maintenance of fire occurrence data. Specifically, IRWIN has provided an end-to-end fire reporting system focused on the goals of reducing redundant data entry, identifying authoritative data sources, and improving the consistency, accuracy, and availability of operational data. Through a multi-year phased approach, the IRWIN Project is tasked with identifying and integrating fire occurrence data from a number of different sources and applications.
Fire occurrence data from IRWIN are routinely ingested into a database maintained by MTBS and other postfire mapping programs, and currently make up the bulk of the records used by MTBS to identify candidate fires for mapping.
Satellite Image Selection and Pre-processing
For fire events that meet the minimum size requirement for MTBS mapping, corresponding Landsat and Sentinel-2 scenes are selected based upon the reported location and ignition date. After an initial review and determination of the appropriate assessment strategy: initial, extended or single scene, candidate prefire and postfire scenes are reviewed and downloaded using tools and applications developed by USGS-EROS, such as Earth Explorer and GloVis, and ESA, such as the Copernicus Open Access Hub for Sentinel-2 data. Limitations due to scene quality are common in areas prone to cloud cover (e.g., the Southeast United States). Other atmospheric conditions such as smoke from active fires, terrain shadows and other obscurations also reduce the number of candidate scenes. In addition, northern latitudes are subject to a shorter period of optimal scene selection due to undesirable sun angles in the fall and a shorter growing season.
Downloaded Landsat scenes are processed to generate top-of-atmosphere reflectance images according to existing USGS-EROS protocols that include geometric (including terrain correction) and radiometric correction. Downloaded Sentinel-2 scenes are received as top-of-atmosphere, terrain corrected products. Prior to processing the imagery into a burn severity product, prefire and postfire images are inspected for co-registration accuracy and corrected if spatial differences are noted.
Using the reflectance imagery, an NBR image is generated for each prefire and postfire scene and then differenced to create a dNBR. An RdNBR is also calculated to evaluate potential limitations of dNBR to characterize fire severity on low biomass sites and potentially enhance inter-fire comparability of the results at larger ecological scales. Processing the Landsat image data to NBR, dNBR and RdNBR is a straightforward series of calculations relying principally on automated production sequences.


Burned Area Boundary Delineation
The burned area boundary is delineated by on-screen interpretation of the reflectance imagery and the NBR, dNBR and RdNBR images. The mapping analyst digitizes a perimeter to include any detectable fire area derived from these images. Clouds, cloud shadows, snow or other anomalies intersecting the fire area are also delineated and used to generate a mask later in the workflow. To ensure consistency and high spatial precision, digitization is performed at on-screen display scales between 1:24000 and 1:50000.
Burn Severity Interpretation
The process of developing a categorical burn severity product is subjective and is dependent on analyst interpretation. The analyst evaluates the dNBR data range and determines where significant thresholds exist in the data to discriminate between burn severity classes. Interpretations are conducted on the NBR, dNBR and RdNBR data, aided by the prefire and postfire imagery, and analyst experience with fire behavior and effects in a given ecological setting. Where available, high resolution imagery is visually inspected to provide confidence in selecting the burn severity thresholds.
Thresholding dNBR data into thematic class values results in an intuitive map depicting a manageable number of ecologically significant classes (typically 4 to 7 class values). There are uncertainties in this approach stemming from analyst subjectivity and limited field data(e.g., CBI data) to guide threshold selection. Ecological significance of burn severity classes will also likely vary across regions and landscapes and one set of thresholds cannot be expected to apply equally well to all analysis objectives and management issues.
Data Distribution
The primary access point for acquiring MTBS data is through the program’s website: https://www.mtbs.gov. There you will find an interactive viewer which allows users to search for and download individual fire data in addition to direct download options for state and national data products. Connection information is also provided for those interested in using web map services.