NDVI Profile Tool Help
You can type in the four-digit Landsat Path/Row (if known). In this example "2930", Landsat Path/Row over Sioux Falls, SD, was typed in.
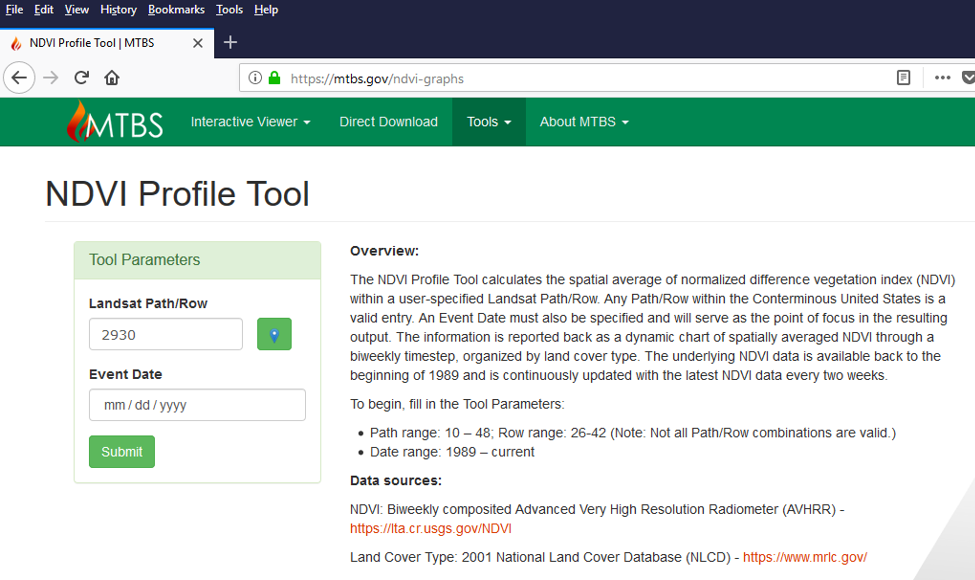
Figure 1. NDVI Tool Landsat Path Row Entry. Another option is to click on the map maker icon (highlighted in red).
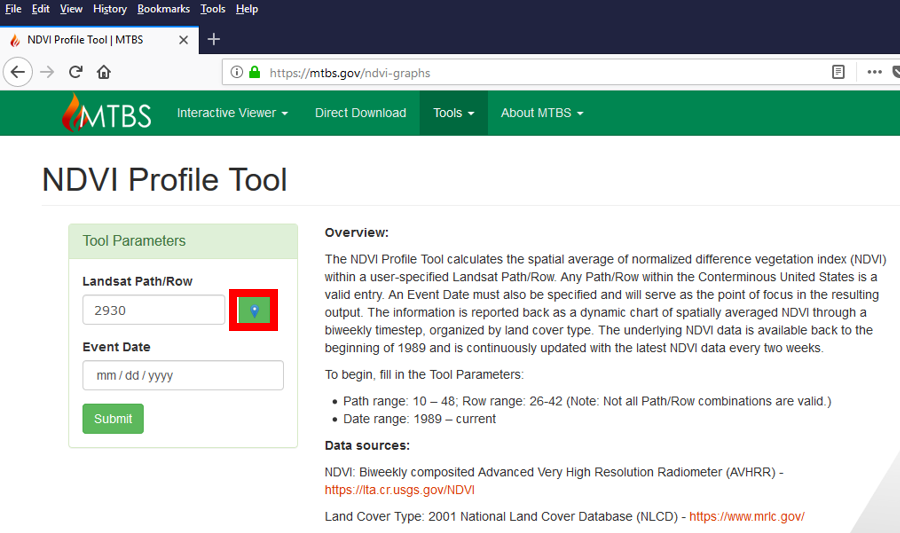
Figure 2. NDVI Tool Map Maker Icon. This will bring up a map. Click anywhere in the conterminous US, and the correct Path/Row will be added to the Landsat Path/Row box. In this example an area near Sioux Falls, SD was clicked on yielding the Landsat Path/Row "2930".
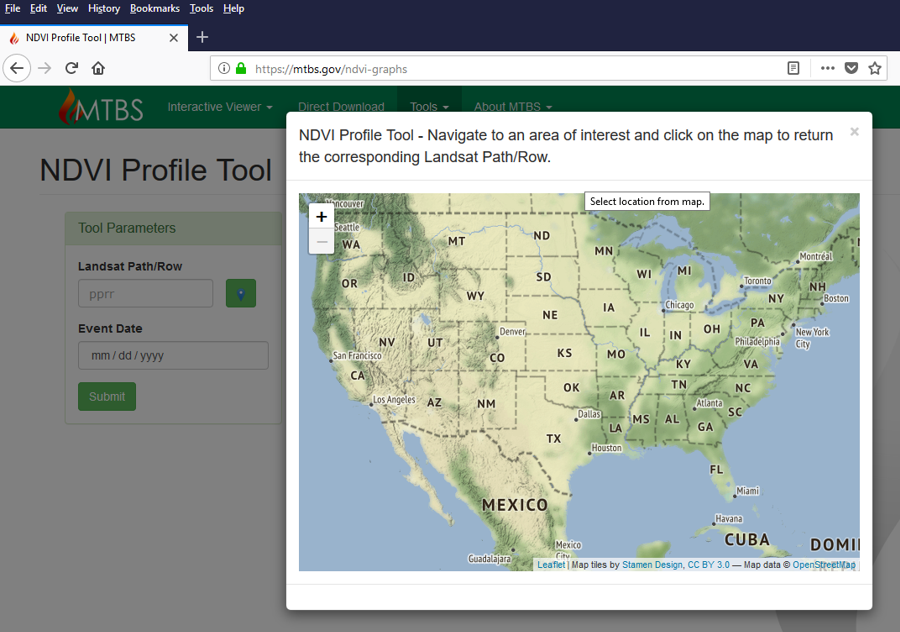
Figure 3. NDVI Tool Map Click to Select Landsat Path and Row. You can now enter in the date (highlighted in red) of the event that you want to examine
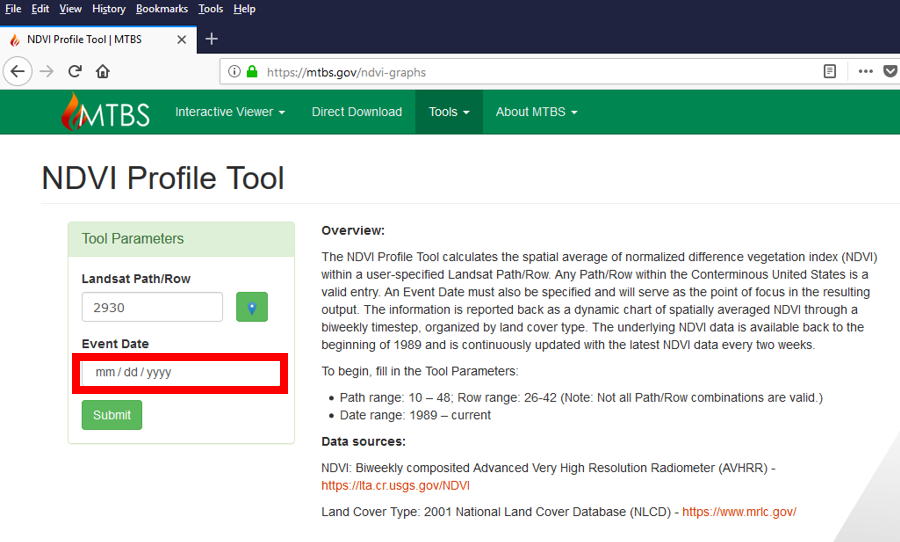
Figure 4. NDVI Tool Date Entry. Either type in the date or use the calendar to select the date from the pop-up calendar
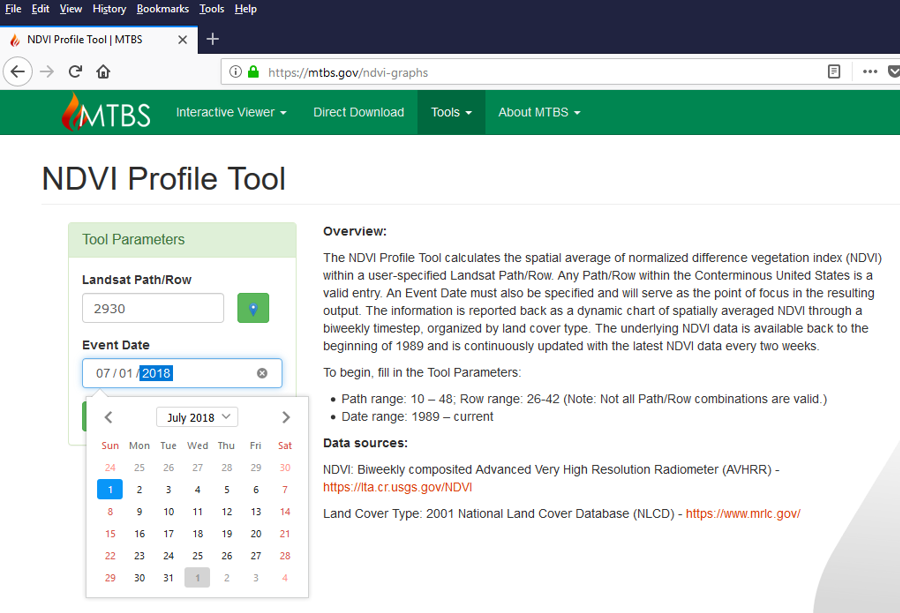
Figure 5. NDVI Tool Select Date from Calendar In this example, we decided to use the date of 7/1/2018.
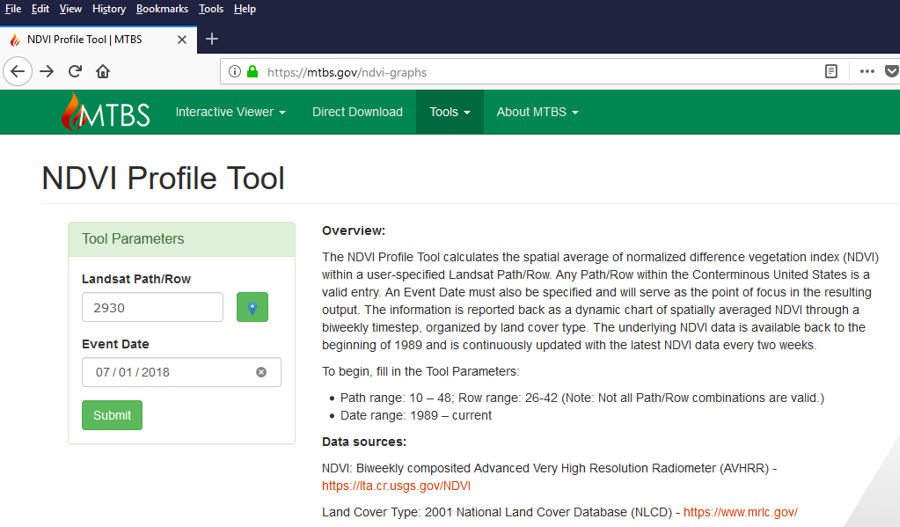
Figure 6. NDVI Tool Date Entry Example. Click on "Submit"
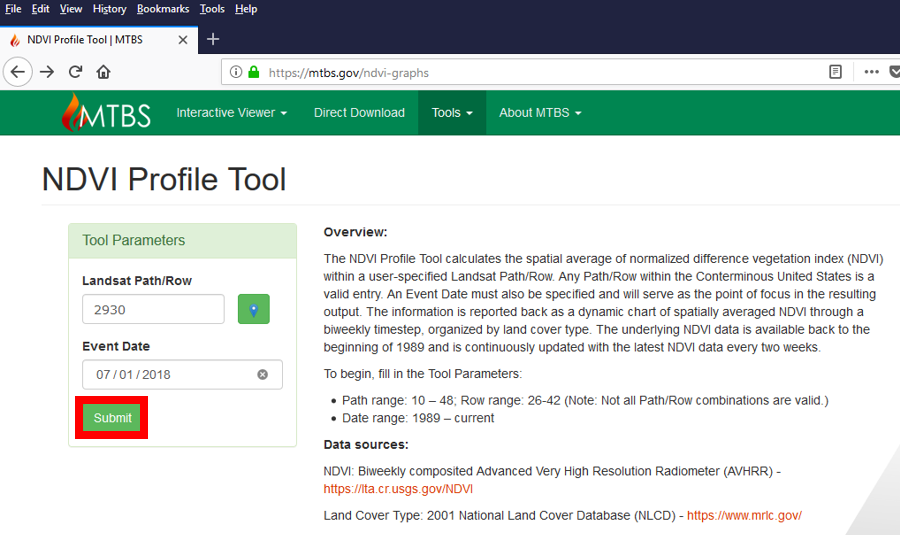
Figure 7. NDVI Tool Submit Button. The NDVI graph with the 1-year pre-event and event image date will show on the graph. Note that the curve changes based on the vegetation that is being show.
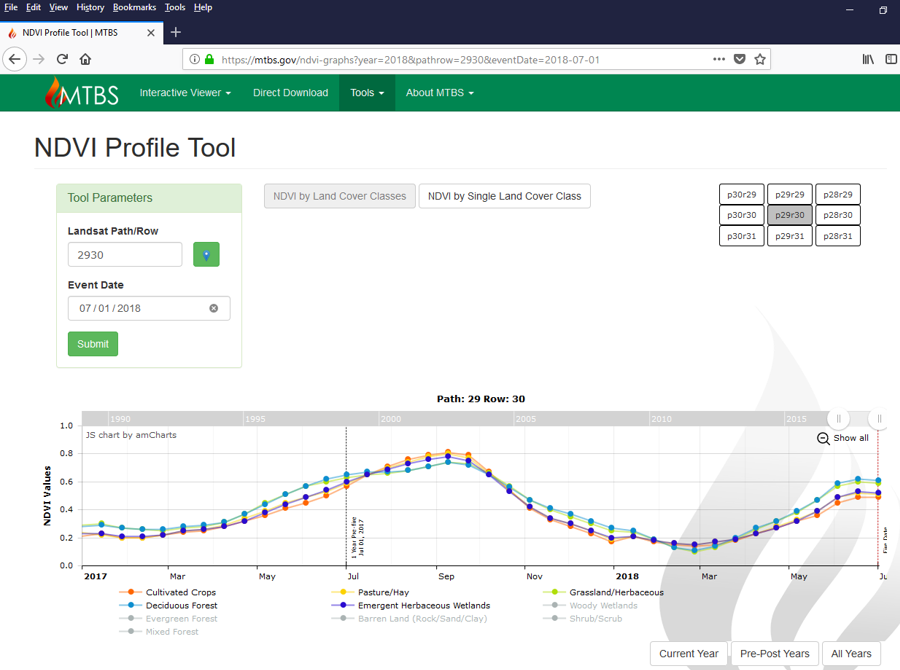
Figure 8. NDVI Tool Graph 1-Year Pre-Event and Event Image Date You could also just pick one vegetation type by clicking on the vegetation types that you don’t want to examine.
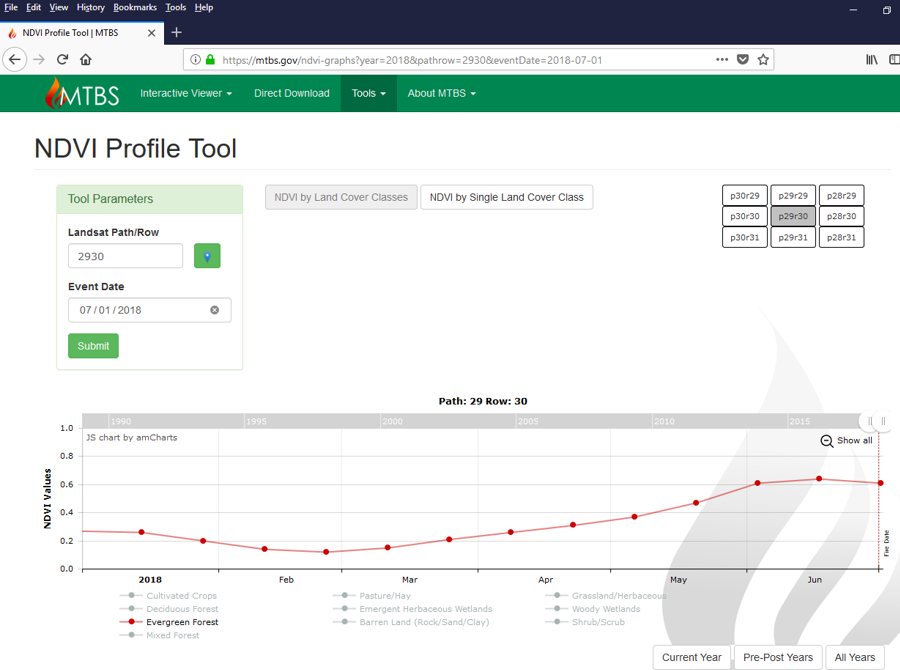
Figure 9. NDVI Graph Single Vegetation Type Or, you can select one vegetation type by selecting the NDVI Single Landcover class tab (highlighted in red)
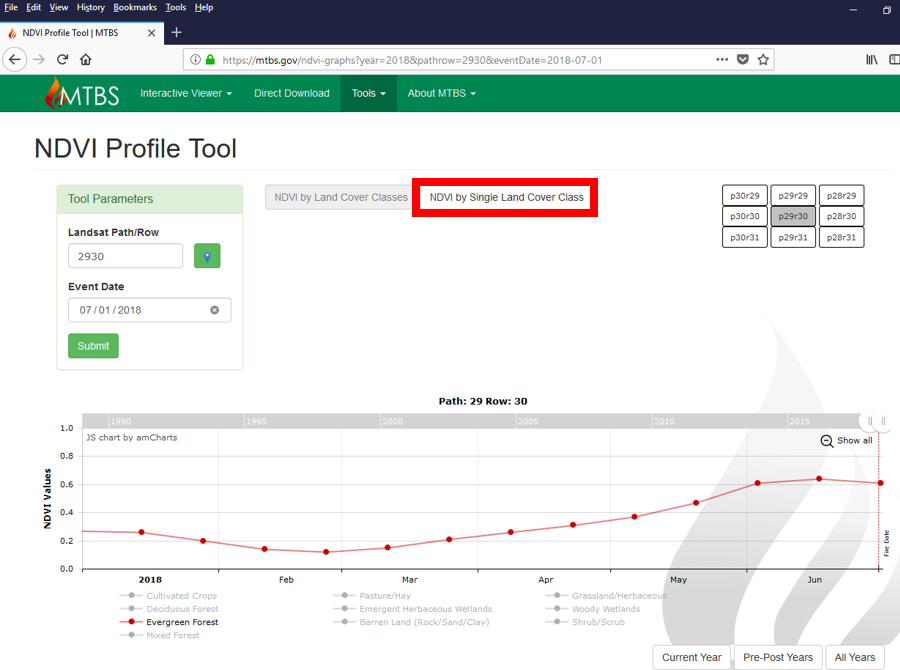
Figure 10. NDVI Graph Select Single Landcover Class Selecting the NDVI Single Landcover class tab yields all years by one vegetation type.
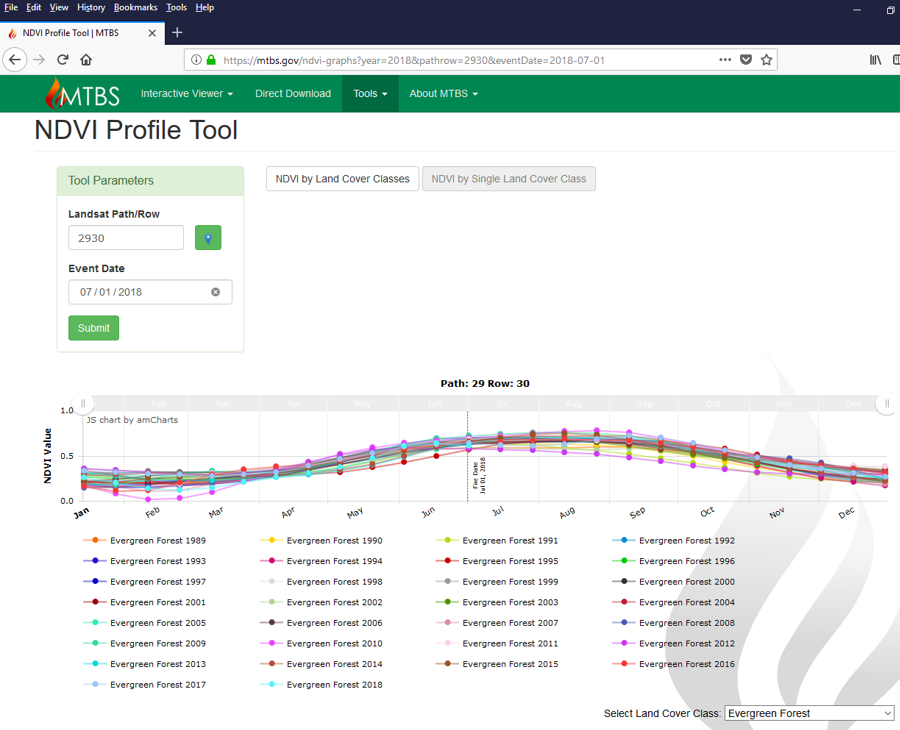
Figure 11. NDVI Graph All Years by One Vegetation Type To show all years NDVI curves, click on "Show all" (highlighted in red).
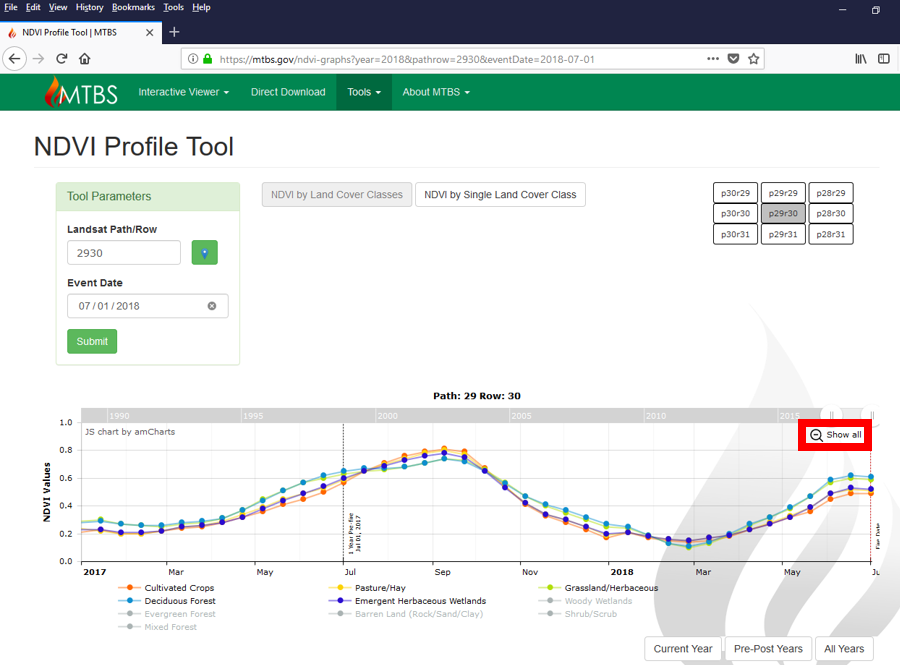
Figure 12. NDVI Graph All Years NDVI Curves All vegetation curves between 1989 until the present will be shown.
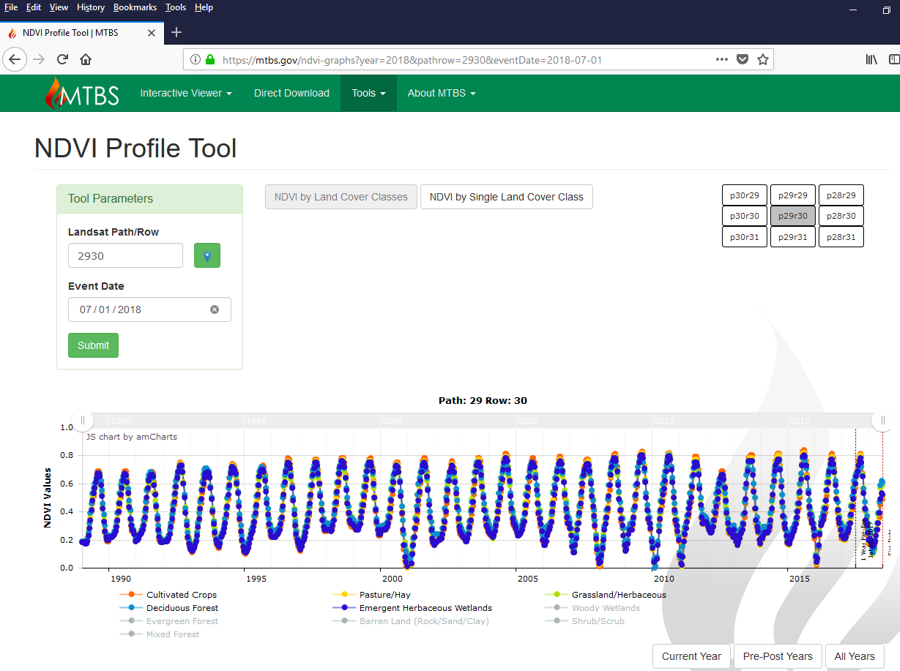
Figure 13. NDVI Graph Vegetation Curves by Date Range You can also move the date sliders (highlighted in red) to display NDVI data by a specific date range.
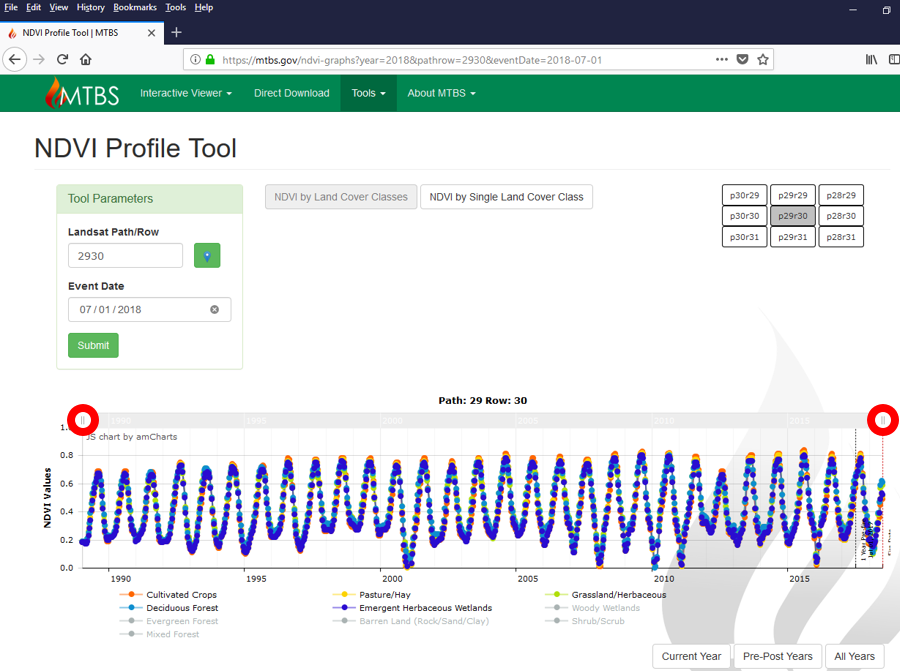
Figure 14. NDVI Graph Vegetation Curves by Date Range Slider In this example we moved the left date slider to 2015 and the right date slider to 2017 to display the 2015-2017 NDVI data.
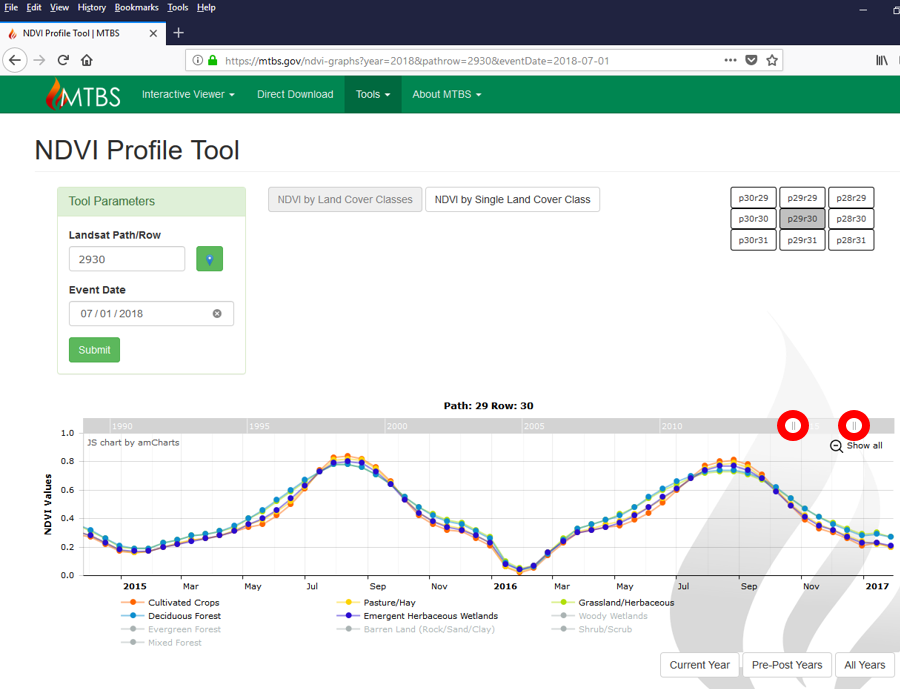
Figure 14. NDVI Graph Vegetation Curves by Date Range Slider To look at the NDVI curves of adjacent Path/Rows, you can click on any of the six surrounding Path/Rows. In this example we will examine the NDVI graph for Path 30/Row 29 (highlighted in red).
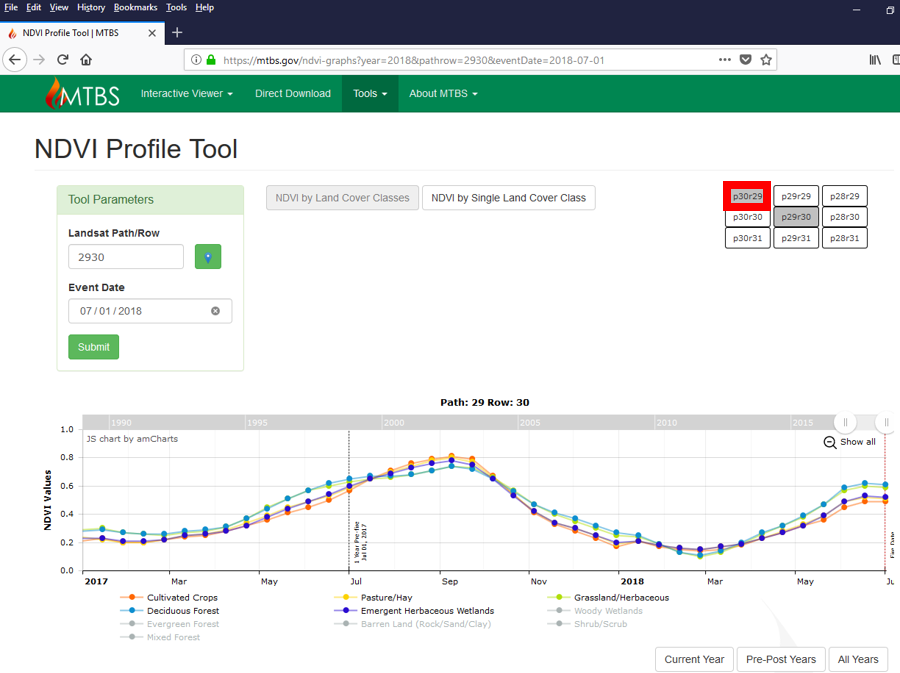
Figure 16. NDVI Graph Curves by Adjacent Path Rows You might want to examine adjacent Path/Rows if you’re determining whether you want to use pixels from overlapping scenes for you event mapping analyses. As you can see, the path/rows have similar NDVI curves suggesting that they could be used together.
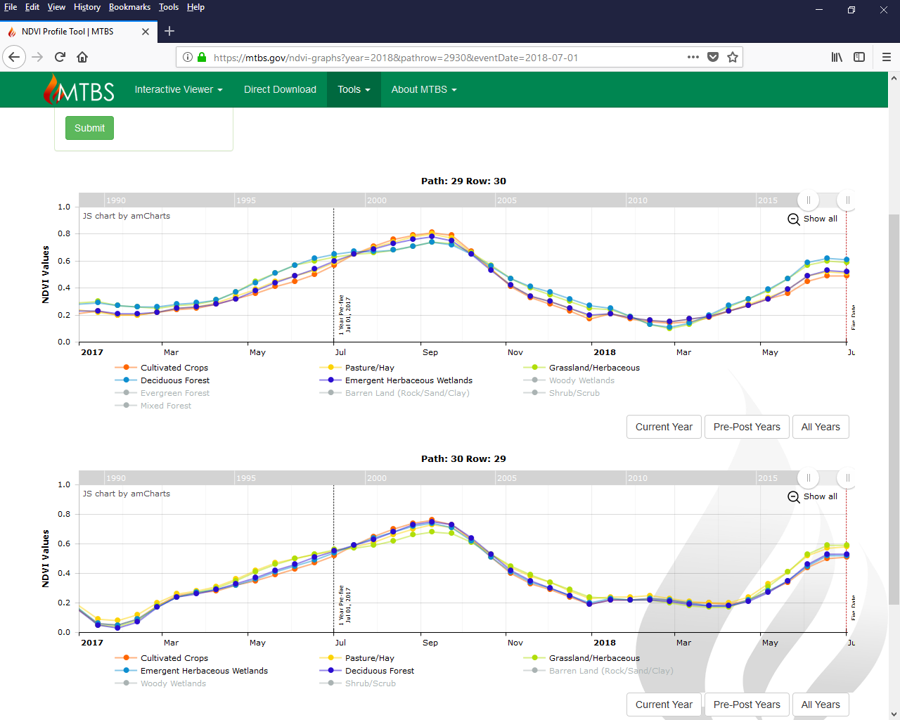
Figure 17. Screenshot of the NDVI Graph Curves by Adjacent Path Rows Example